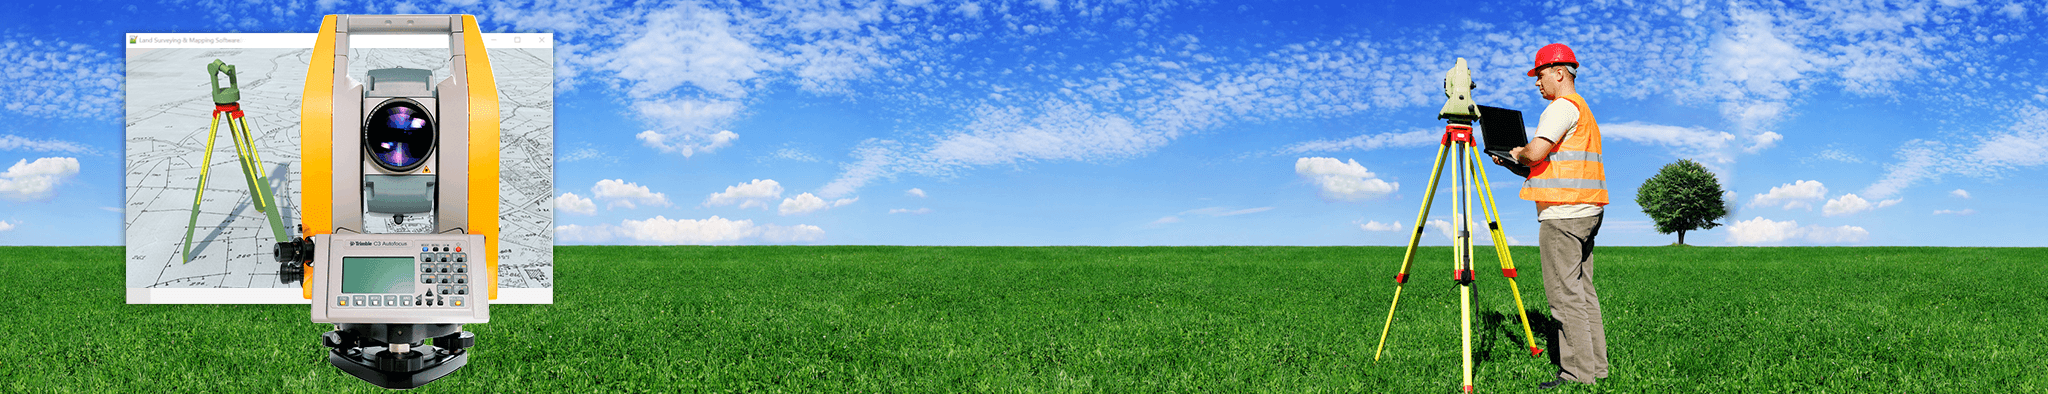
How LiDAR Mapping Is Improving Flood Risk Detection in Modern Land Surveying
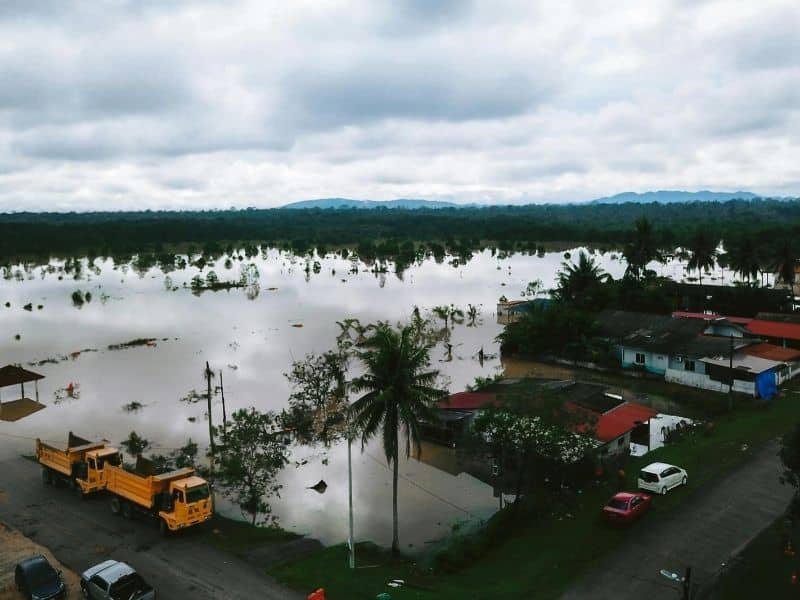
Floods damage homes, wash out roads, and hurt communities every single year. Most old flood maps use rough estimates that miss small but important details about how land slopes. People often build or prepare based on these outdated files, so they end up facing risks they never saw coming. LiDAR mapping changes this by giving a sharp and exact look at every rise and dip across an area. It spots tiny changes in height that older tools cannot catch, so everyone can see where floods are most likely to happen long before storms hit.
How LiDAR Mapping Identifies Micro-Elevation Changes That Increase Flood Exposure
Water always flows to the lowest spot it can find. Even a three-centimeter drop can pull water toward houses instead of empty fields. Old survey methods only check points every 30 to 50 meters apart, so they skip shallow dips, worn paths, or ground that has sunk slowly over time. These small shifts look unimportant to the naked eye, but they can turn a safe street into a fast channel of runoff. LiDAR shoots thousands of laser pulses each second from planes, drones, or trucks. It measures every square meter of ground down to the centimeter, so no hidden slope or hollow goes unnoticed.
This matters most for coastal towns and low-lying villages. Land that sinks just a few centimeters over ten years becomes much more likely to flood during high tides or heavy rains. LiDAR tracks these small changes year after year, so local leaders can adjust rules before serious damage happens. It also shows how paved lots push water toward grassy yards, creating uneven risks that old maps never show.
Turning LiDAR-Derived Terrain Data Into Flood Depth Prediction Models
All those laser measurements create a dense group of points that mark the exact height of every rock, patch of dirt, and slope. Surveyors remove points that show trees, buildings, or cars, then build what is called a Digital Elevation Model. This is a perfect digital copy of the bare ground surface. Engineers use these files to test how water spreads during different storms. The program works out how fast water moves, which way it flows, and how deep it will get in every block or even single lot.
For example, a test might show one village will fill with water up to window height in four hours, while a nearby village stays dry. It can also show where fast currents will hit bridges or narrow roads. These results do not come from guesswork. They come straight from the real shape of the land, so teams can build better drains and barriers that actually work.
Why Traditional Flood Maps Fail Without High-Resolution LiDAR Inputs
Common flood maps like those from FEMA or local agencies often use data from 20, 30, or even 50 years ago. They mark huge areas as one single risk level and ignore small differences in shape. They also cannot tell the difference between the top of a tree and the ground below it, so they sometimes label hills as flood zones or hide dangerous dips under forests. Many towns still trust these maps, only to see floods hit areas marked safe.
LiDAR works through leaves and branches to measure the soil itself, so trees never mess up results. It also takes new readings whenever needed, so maps match how land looks right now instead of how it looked decades ago. When towns switch to LiDAR data, flood lines often move hundreds of meters. These changes put properties in the right risk group and stop people from trusting wrong safety marks.
Using LiDAR Mapping to Detect Hidden Drainage Pathways and Water Accumulation Zones
Many paths that carry floodwater leave no visible sign today. Old creeks filled in for new roads, shallow grassy dips, or low spots blocked by curbs still pull water toward them when it rains hard. Standard maps rarely show these features, so engineers design drains that miss them completely. LiDAR picks up these faint grooves and closed basins even if no one has seen them for years.
Features LiDAR finds include:
- Filled-in stream beds that still catch lots of runoff
- Low pockets with no exit where water sits for days after rain
- Slopes that push water straight toward house foundations
- Gaps where water seeps under roads and weakens the ground
Cities use this information to dig new channels, add more catch basins, or keep new buildings away from these natural flow paths. These small changes stop light rains from causing big problems.
How Insurance and Planning Decisions Rely on LiDAR-Based Flood Risk Classification
Insurance companies once charged similar rates for all homes in one flood zone, even if some sat high up and others sat in deep dips. Developers also got approval for projects that trap water just because old maps missed the risk. LiDAR gives clear risk scores for every single property, so costs and choices make more sense. Leaders can split big zones into smaller groups based on exact height, distance from flow paths, and where water builds up.
Homes on higher ground get lower premiums that match their real risk, while people in vulnerable spots get clear warnings before they buy. Planners can say no to projects in very dangerous areas, or require raised floors and better drains for those that go ahead. Banks also use these scores to make sure they do not invest in sites that will flood easily. Everyone uses the same clear facts, so rules feel fair and plans hold up when storms come.
Frequently Asked Questions
How does LiDAR improve flood risk detection compared to traditional surveying methods?
LiDAR captures very detailed height data that shows small changes in land shape. This lets teams predict flood risks far more accurately than older ground surveys or maps.
Can LiDAR mapping predict where water will collect during heavy rainfall?
Yes. It maps slopes and low spots clearly, so planners can see exactly where water will gather when it rains hard.
Why is elevation accuracy so important in flood risk analysis?
Even tiny differences in height change which way water flows. Exact measurements are needed to tell which areas will flood and which will stay dry.
Do flood insurance providers use LiDAR-based mapping data?
Many insurance companies use LiDAR maps to set fairer rates and check risk for each property more carefully.